7
Segment results (HK$ million)
FY2014
FY2013
Change
Property development
9,586.9
7,338.5
↑
31%
Property investment
2,031.9
1,857.7
↑
9%
Hotel operations
361.4
450.2
↓
20%
Service
1,526.2
1,708.5
↓
11%
Infrastructure
2,518.2
2,462.0
↑
2%
Department stores
543.2
743.7
↓
27%
Others
228.8
785.5
↓
71%
Total
16,796.6
15,346.1
↑
9%
Financial highlights
0%
10%
20%
30%
40%
50%
60%
70%
80%
90%
100%
FY2013
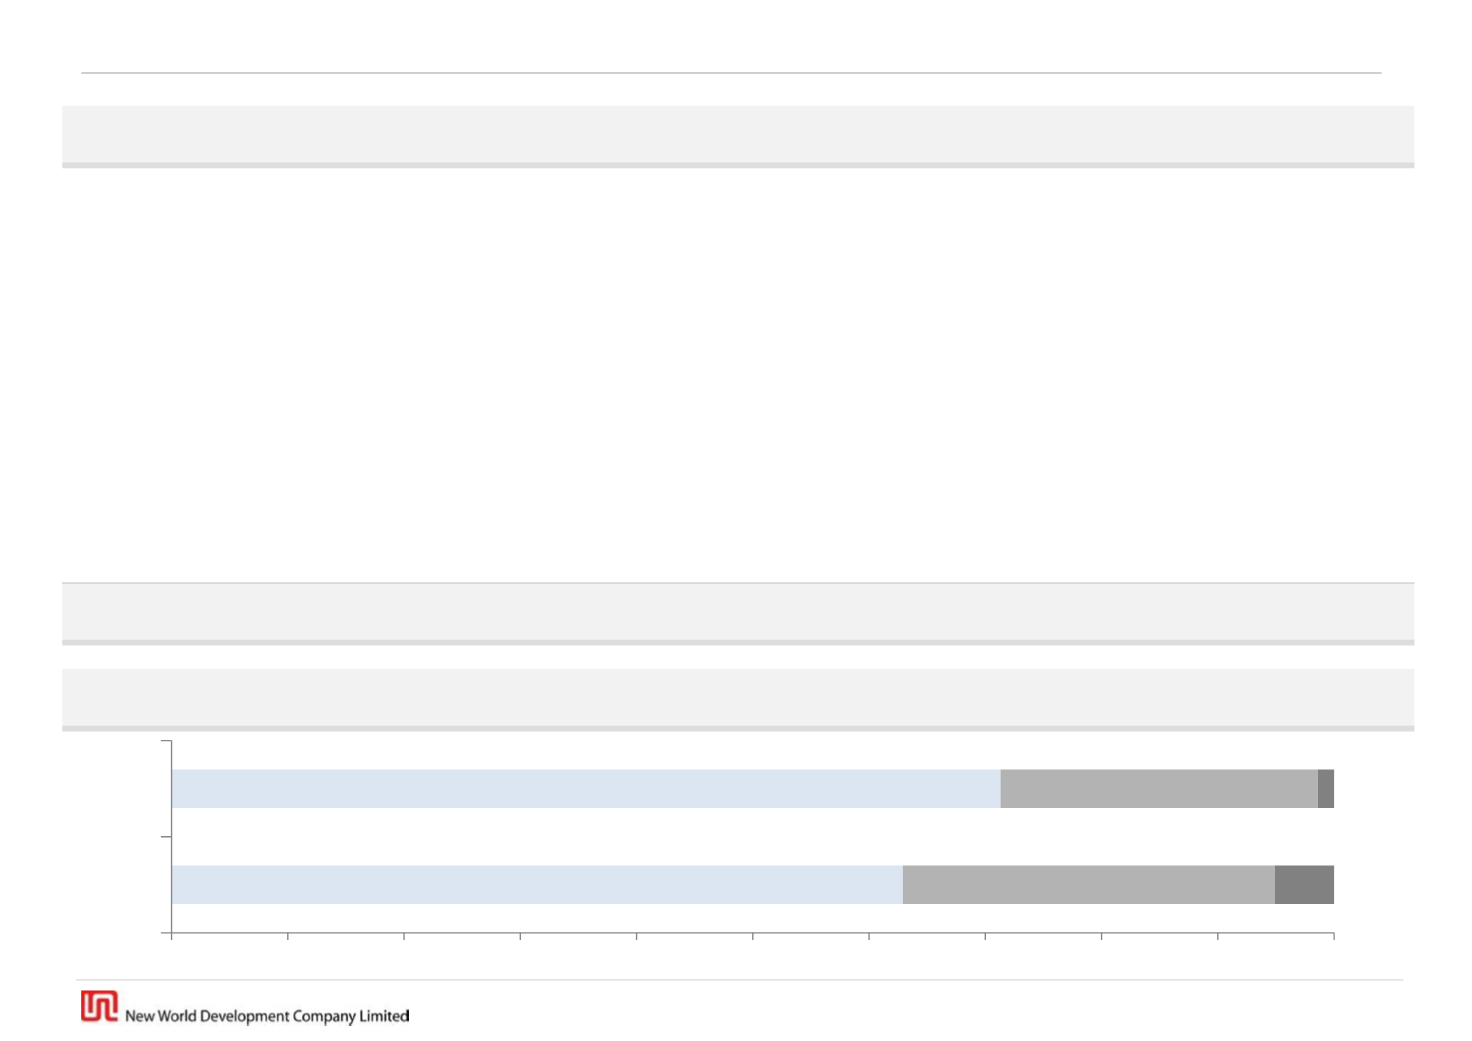
FY2014
Segment results analysis
Core property businesses 71.3%
Core property businesses 62.9%
Infra/Service/Dept stores 32.0%
Infra/Service/Dept stores 27.3% Others 1.4%
Others 5.1%
YoY
↑
8.4% pts


